Assessment
PISA, TIMSS and PIRLS: What actually are they and what do they tell us?
According to the latest PISA results, England’s science scores are still on a downward trajectory that started a decade ago. Yet TIMSS, another respected study, has science performances rising. Which of them is right? Is one more valid than the other? In this blog AQi examines three International Large-Scale Assessments and finds that, although they may look the same from a distance, get up close and you’ll find they are very different beasts.
Are all measures equal?
The PISA (Programme for International Student Assessment) rankings for maths, reading and science are some of the most eagerly anticipated data in the education world. Their publication prompts headlines, applause, criticism and sometimes soul searching.
The same goes for two other well-respected International Large-Scale Assessments - TIMSS (Trends in International Mathematics and Science Study) and PIRLS (Progress in International Reading Literacy Study).
You might think that these three assessments would pick up similar trends in each country where they are used, but that is not always the case.
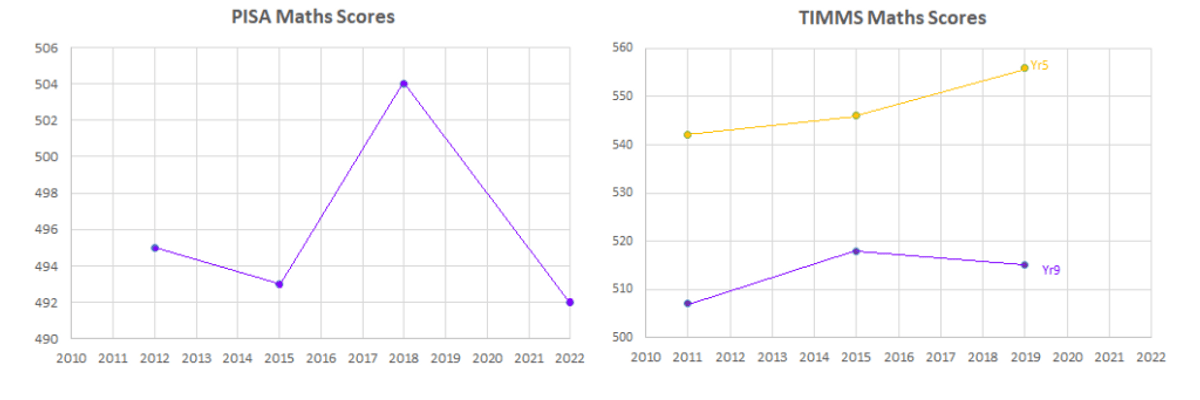
For example, PISA’s last report showed that English students’ maths had declined, and that a downward trend in science performances, which started in 2012, was continuing.
But analyse TIMSS’ data and you’ll see that maths performances have been on an upward trend for both Year 5 and Year 9 students since 2011.
Not only that, when it comes to science, TIMSS recorded eight years of continual improvement by Year 5 students.

PISA’s findings on reading skills also seemingly conflict with those of PIRLS.
In its 2023 report, PISA recorded a 10point drop for England on its previous study (roughly equivalent to six month’s schooling).
Compare that with PIRLS’ 2023 report which showed England’s literacy score had fallen a statistically insignificant one point, even though the country had been through a challenging lockdown.

So, why do separate studies of the same subjects come up with different findings? Can they be compared?
To answer these questions let’s examine PISA, TIMSS and PIRLS, see how they work and what they measure.
PISA – The Programme for International Student Assessment
PISA has been conducted by the OECD since 2000 and is the most high-profile International Large-Scale Assessment.
It relies on a minimum of 150 schools with 4,500 to 10,000 students in each country/economy. The last survey involved 81 countries and almost 700,000 students.
It evaluates 15-year-olds’ ability to use their reading, maths and science skills and knowledge to solve ‘real life’ problems and is produced every three years.
Students sit computer-based assessments over two hours with a mix of multiple-choice and open-ended questions. They also complete questionnaires about themselves and their school, including behaviour and discipline.
Teachers, headteachers and parents also complete questionnaires about lessons and the wider school/home environment.
PISA's Selling point
Pisa is the biggest global measure of education performance levels.
The breadth of its reach and depth of its testing goes beyond the other international studies.
It measures attainment in a wider range of subjects than PIRLS and TIMSS.
The statistics it produces allow policymakers, educationalists and others to draw comparisons between education systems, examine elements within those systems and track changes over time.
PIRLS - The Progress in International Reading Literacy Study
PIRLS was first carried out in 2001 and is run by the International Association for the Evaluation of Educational Achievement – a co-operative of national research institutions, government agencies, educational researchers and analysts in more than 60 countries.
The IEA (CORR) conducts its study every five years on pupils aged 9-10.
PIRLS 2021 results were based on data from around 400,000 students, 20,000 teachers, 13,000 schools and 57 education systems.
The study, which students can sit either digitally or using pen and paper, uses multiple-choice and open-ended questions to assess the reading attainment of pupils focusing on reading for literary experience and reading to acquire and use information.
PIRLS assesses pupils in two 40-minute sessions. They also complete a questionnaire about their attitudes to learning, while teachers, headteachers and parents submit one about lessons and the wider school/home environment.
PIRLS' Selling point
The assessment is designed in collaboration between PIRLS and national bodies to fit each country’s curriculum. Each assessment is linked to the preceding one which means policymakers can compare their own results over time, make global comparisons and set benchmarks.
Texts used are constantly being reviewed to ensure they reproduce the student’ typical reading experience, are clear and coherent, and culturally relevant to each country.
By assessing literacy skills in younger students, PIRLS identifies potential problems early which allows for targeted interventions and support.
Policymakers can use PIRLS findings to share best practice, shape policy and allocate resources.
TIMSS – The Trends in International Mathematics and Science Study
TIMSS has been going since 1995 and is also run by the International Association for the Evaluation of Educational Achievement.
It is typically conducted every four years and taken by two groups of students - one aged around 10 and another around 14.
The 2019 study involved 580,000 students in 64 countries and 8 benchmarking systems.
The 90-minute assessment is available in digital or paper formats. It is split into two sessions and uses multiple-choice and open-response questions to evaluate maths and science knowledge as well as reasoning and application skills. There are also wider context questionnaires for students, teachers, headteachers and parents.
TIMSS' Selling point
TIMSS designs the assessment in collaboration with national bodies to fit each country’s curriculum. It refines or adapts assessments for each cycle to account for changes to the curriculum or other areas. This means policymakers can compare their own results over time, make global comparisons and set benchmarks.
By assessing two age groups four years apart and in four-year cycles, TIMSS shows how students are progressing. It also measures the effectiveness of interventions and identifies potential problems early in students’ education journey which allows for targeted support or curriculum improvement.
What are the differences between PISA, PIRLS and TIMSS?
They test different things
PIRLS/TIMSS are designed to evaluate students’ command of the curriculum and ability to apply their learning and skills.
PISA on the other hand aims to evaluate the country’s education system and emphasises socio-economic and equity factors. For this reason it is important that a representative selection of students sit the assessment which is not always the case.
These Large-Scale Assessments assess the abilities of different aged pupils
Reading
PIRLS looks at reading for enjoyment and information retrieval and use in Primary pupils.
PISA measures a wider range of literacy skills in secondary students, from basic decoding of text to “knowledge about the world.”
Maths/Science
TIMSS assesses students’ understanding of concepts in maths and science and their application mainly using multiple-choice and open-response questions.
PISA uses interactive computer-based assessment and performance-based tasks as well as traditional multiple-choice and open-response questions. The framework is based on the Real Mathematics Education (RME) philosophy which means that education systems using standards that match RME are more likely to score highly on PISA but not TIMSS.
How comparable are the results from PISA, PIRLS and TIMSS?
Research has shown that TIMSS and PISA provide similar pictures of student achievement at the country level. A recent assessment found close alignment between country mean scores from both studies. That study of the 2015 TIMSS and PISA results found the higher achieving East Asian countries did better in TIMSS maths than their PISA results predicted, while some Nordic and English-speaking countries did a little better in PISA.
We should note here that the TIMSS and PISA scales are different even though both are centred around 500 with a standard deviation of 100. More information on assessment scales can be found on the TIMSS and PISA websites.
What can we conclude about PISA, TIMSS from all of this?
What this shows is that PISA, TIMSS and PIRLS, taken together, can be good indicators of country achievement - on the proviso that the data is robust, and the trend is clear.
Most of the time, however, country-level data is messy and fine details get lost.
These surveys are not granular enough to be of use for policy setting.
Sure, sometimes their findings point in the same direction, but other times they don’t. So how are we supposed to know whether the similarities or differences are real or due to each survey’s own idiosyncrasies?
International assessments set the policy discourse and often pave the way in terms of carrying out surveys at scale, but lack in nuance when there are specific policy issues requiring an answer.
The best way to get those answers is through national assessments tailored to the country and the questions that need to be tackled.
All that said, the vast range of data PISA, TIMSS, PIRLS and others generate can be a boon to researchers in the field.

